Optony USA
Making electric fleet vehicle data actionable
Optony USA
Optony developed a powerful modeling tool in Excel: a pro forma, to enable managers of electric vehicle fleets to get a bird's eye view on their fleet. It lets users see trends, chargers, their whole fleet, cash flow data, even impact on the climate.
Most of the actual insights were buried and and the rough prototype needed a thoughtful transition to a true digital product. Over four weeks, I built an MVP for a web app and mobile platform, cleaning up information hierarchy and surfacing actionable insights along the way.
Disciplines
Human Interface Design
Interaction Design
Design Systems
Product Strategy
Year
2023
Team
Solo Project

A large dashboard allows users to zoom in to specific sites, specific years, and see a year-over-year view of impact on climate, number of vehicles, and cost measures, as well as charging ports and capital costs.
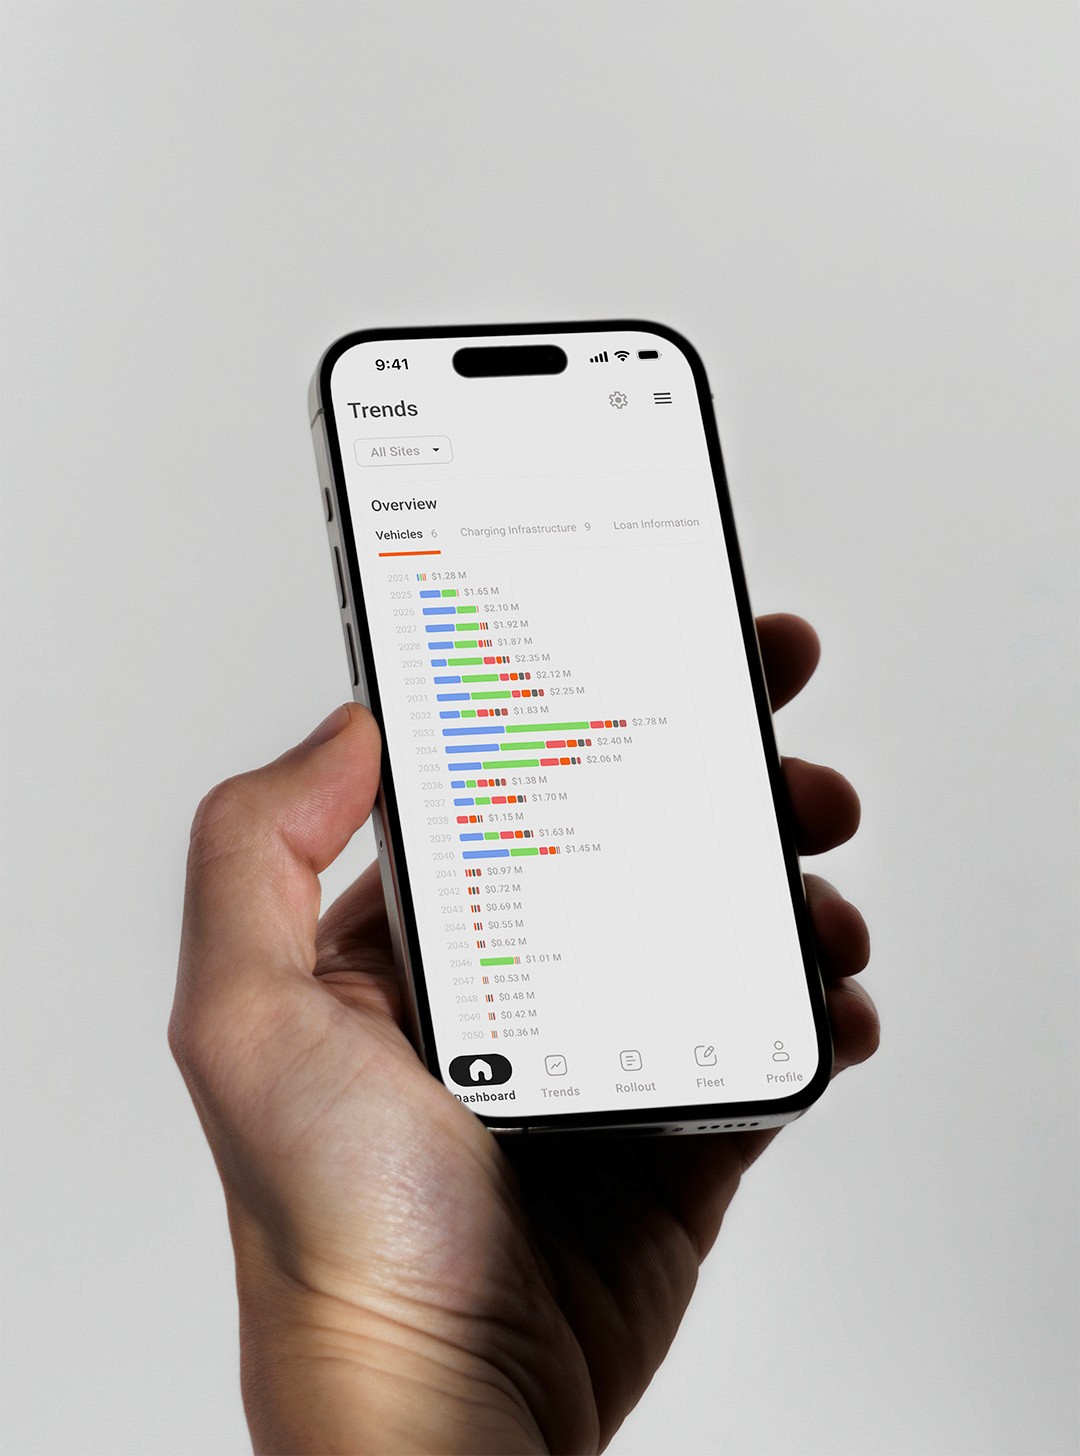
Checking your fleet while on the road? A mobile fleet manager transforms complex data to mobile-friendly views.

Need to run a scenario where loan interest rate or federal incentives are different? Pro controls that adjust the visualizations are accessible in an easy to reach sidebar overlay.
GHG Reductions
All Sites
266
MTCO2
e
Was this good? Bad? Can we improve this?
What were the main drivers of this reduction?
Compared to what?
What even is this number?
Most dashboards aim to look pretty without surfacing real insight
There’s an obsession with metrics right now, and a belief that the more data you have, the better your decisions. In actuality, understanding and displaying data better makes the biggest difference in what data can do for you.
Dashboards should display simplicity, exceptional hierarchy and direct the eye toward the most important elements.

User Persona
User intent matters the most
What does a manager of a fleet need to know? Like any digital product, beginning with the user leads to the clearest outcome. I began by asking about how real users would engage with this dashboard, who they are and what matters most to them. Building the product fell into place once I had a clear vision.

Most data is about comparison
How can we make it easier to tell the difference between two numbers: target and current state, before and after, lows and highs, year 1 and year 15? We make comparisons visually the clearest, though numbers do a great second job at this. In cases a user needs to compare between charts, align the charts to reduce cognitive dissonance.

Early intervention
Getting involved early in projects allows maximal room to shape the future of a tool.
For instance, here I was able to realize that centralizing dashboard tweaks with natural language made users feel more in control of their information.
Leap into the future
Surfacing insights isn’t just about delivering a good product: it’s about trust in Optony’s modeling, good oversight for fleet vehicles, and the potential for repeat business.
What you present says everything about what you value as a company. In a small, competitive space, people come to trust Optony and view them as innovators.

Trust is consistency over time
I essentially brought the lessons of modern data visualization to bear on this product. Drawing from psychology and good design practices, I reorganized, subtracted here, added there, to make for a better experience for fleet managers.
Key Decisions
Drawing from the Law of Proximity and chunking cognitive patterns, group data into clear sections. This helps users preserve a sense of place while looking around. The original prototype I was presented with had controls, data, and summary tables in no particular order on the main dashboard.
Before

After


Add sparklines to shrink 25 years of data into one manageable column. I realized users aren't interested in itemized year-over-year data, they want the broadest shape of a pattern: is this trending up or down? Are there outliers?

Included high and low, and average values for quick scanning.
Research indicated that most values across the 25 year lifespan of most projects don't matter. What matters most is peak and low values that allow fleet managers to take action.
It's best to distill data down to the signal in the noise.
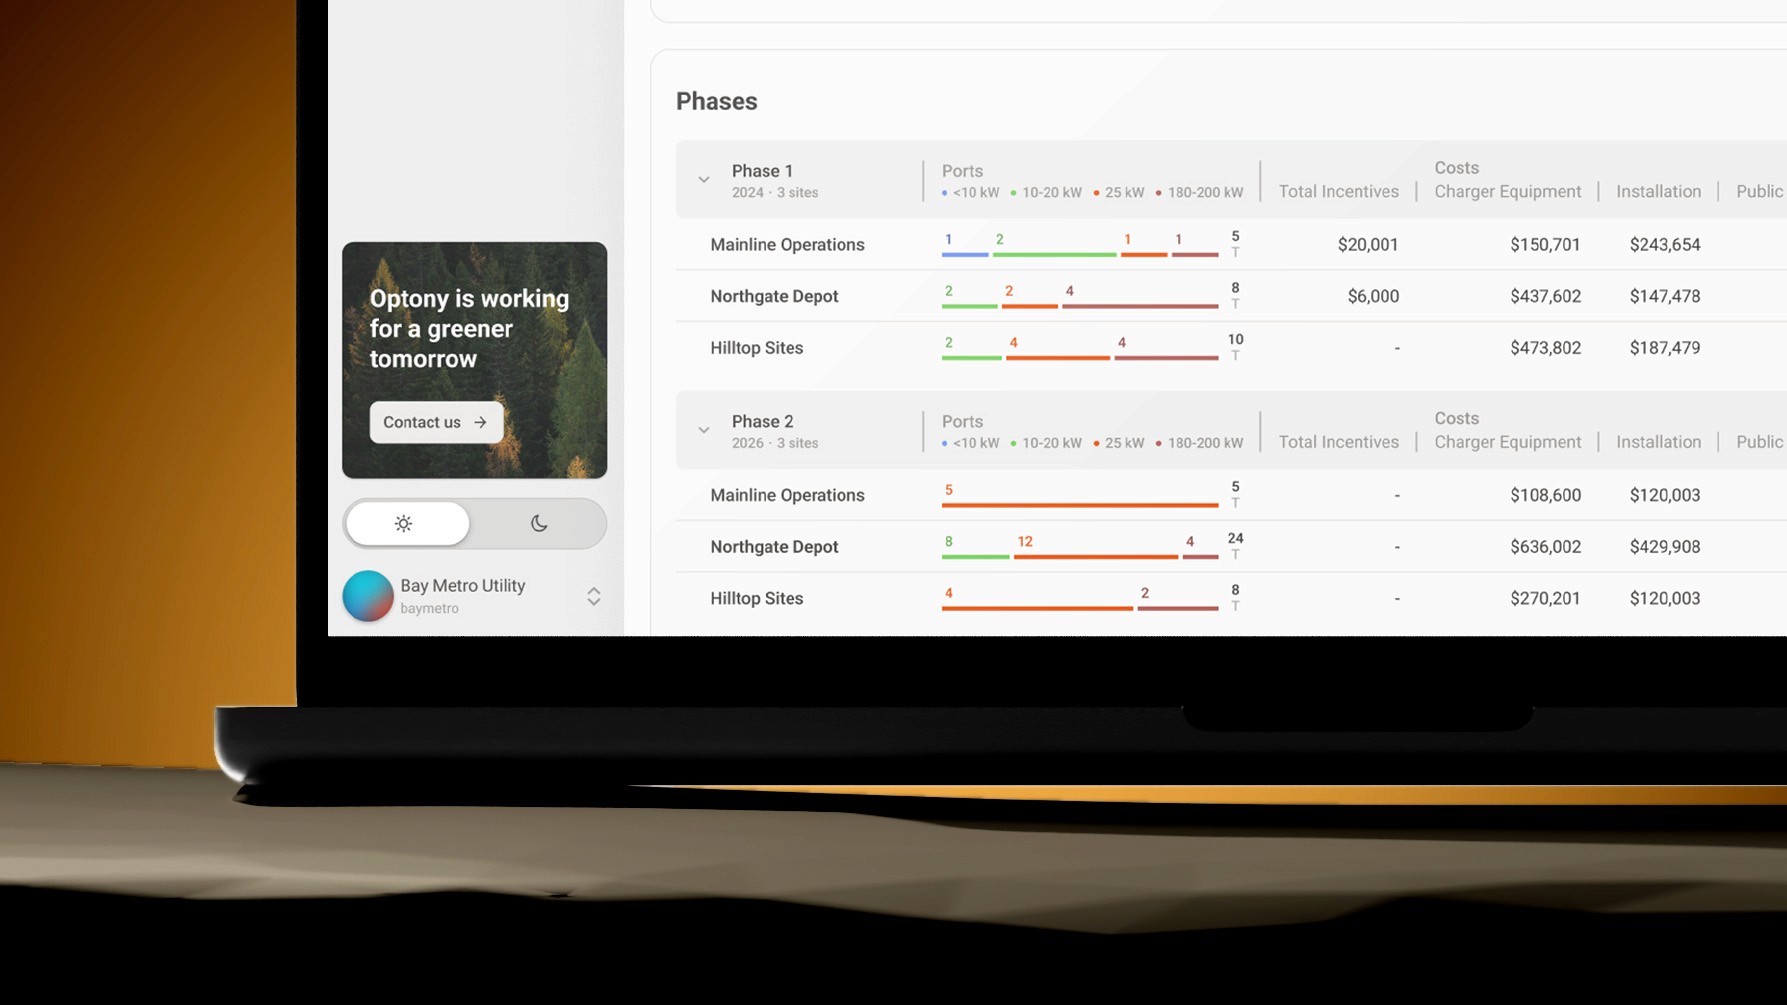
Transform heavy table data into digestible charts. Rather than forcing users to scan long tables for insights, every table had a summary chart above that provides clear, concise insights, and inline charts to compress unwieldy data.


Optony didn't ask for a mobile version, but I couldn't help thinking of how to optimize for mobile experiences anyway. Some of these bar charts have huge numbers of categories (years, mostly) and a vertical orientation served these better.
If I had actually built this today, I'd consider more elegant solutions to solve this problem involving interactions, timeline views, or time scales that morph the data for better comprehension.
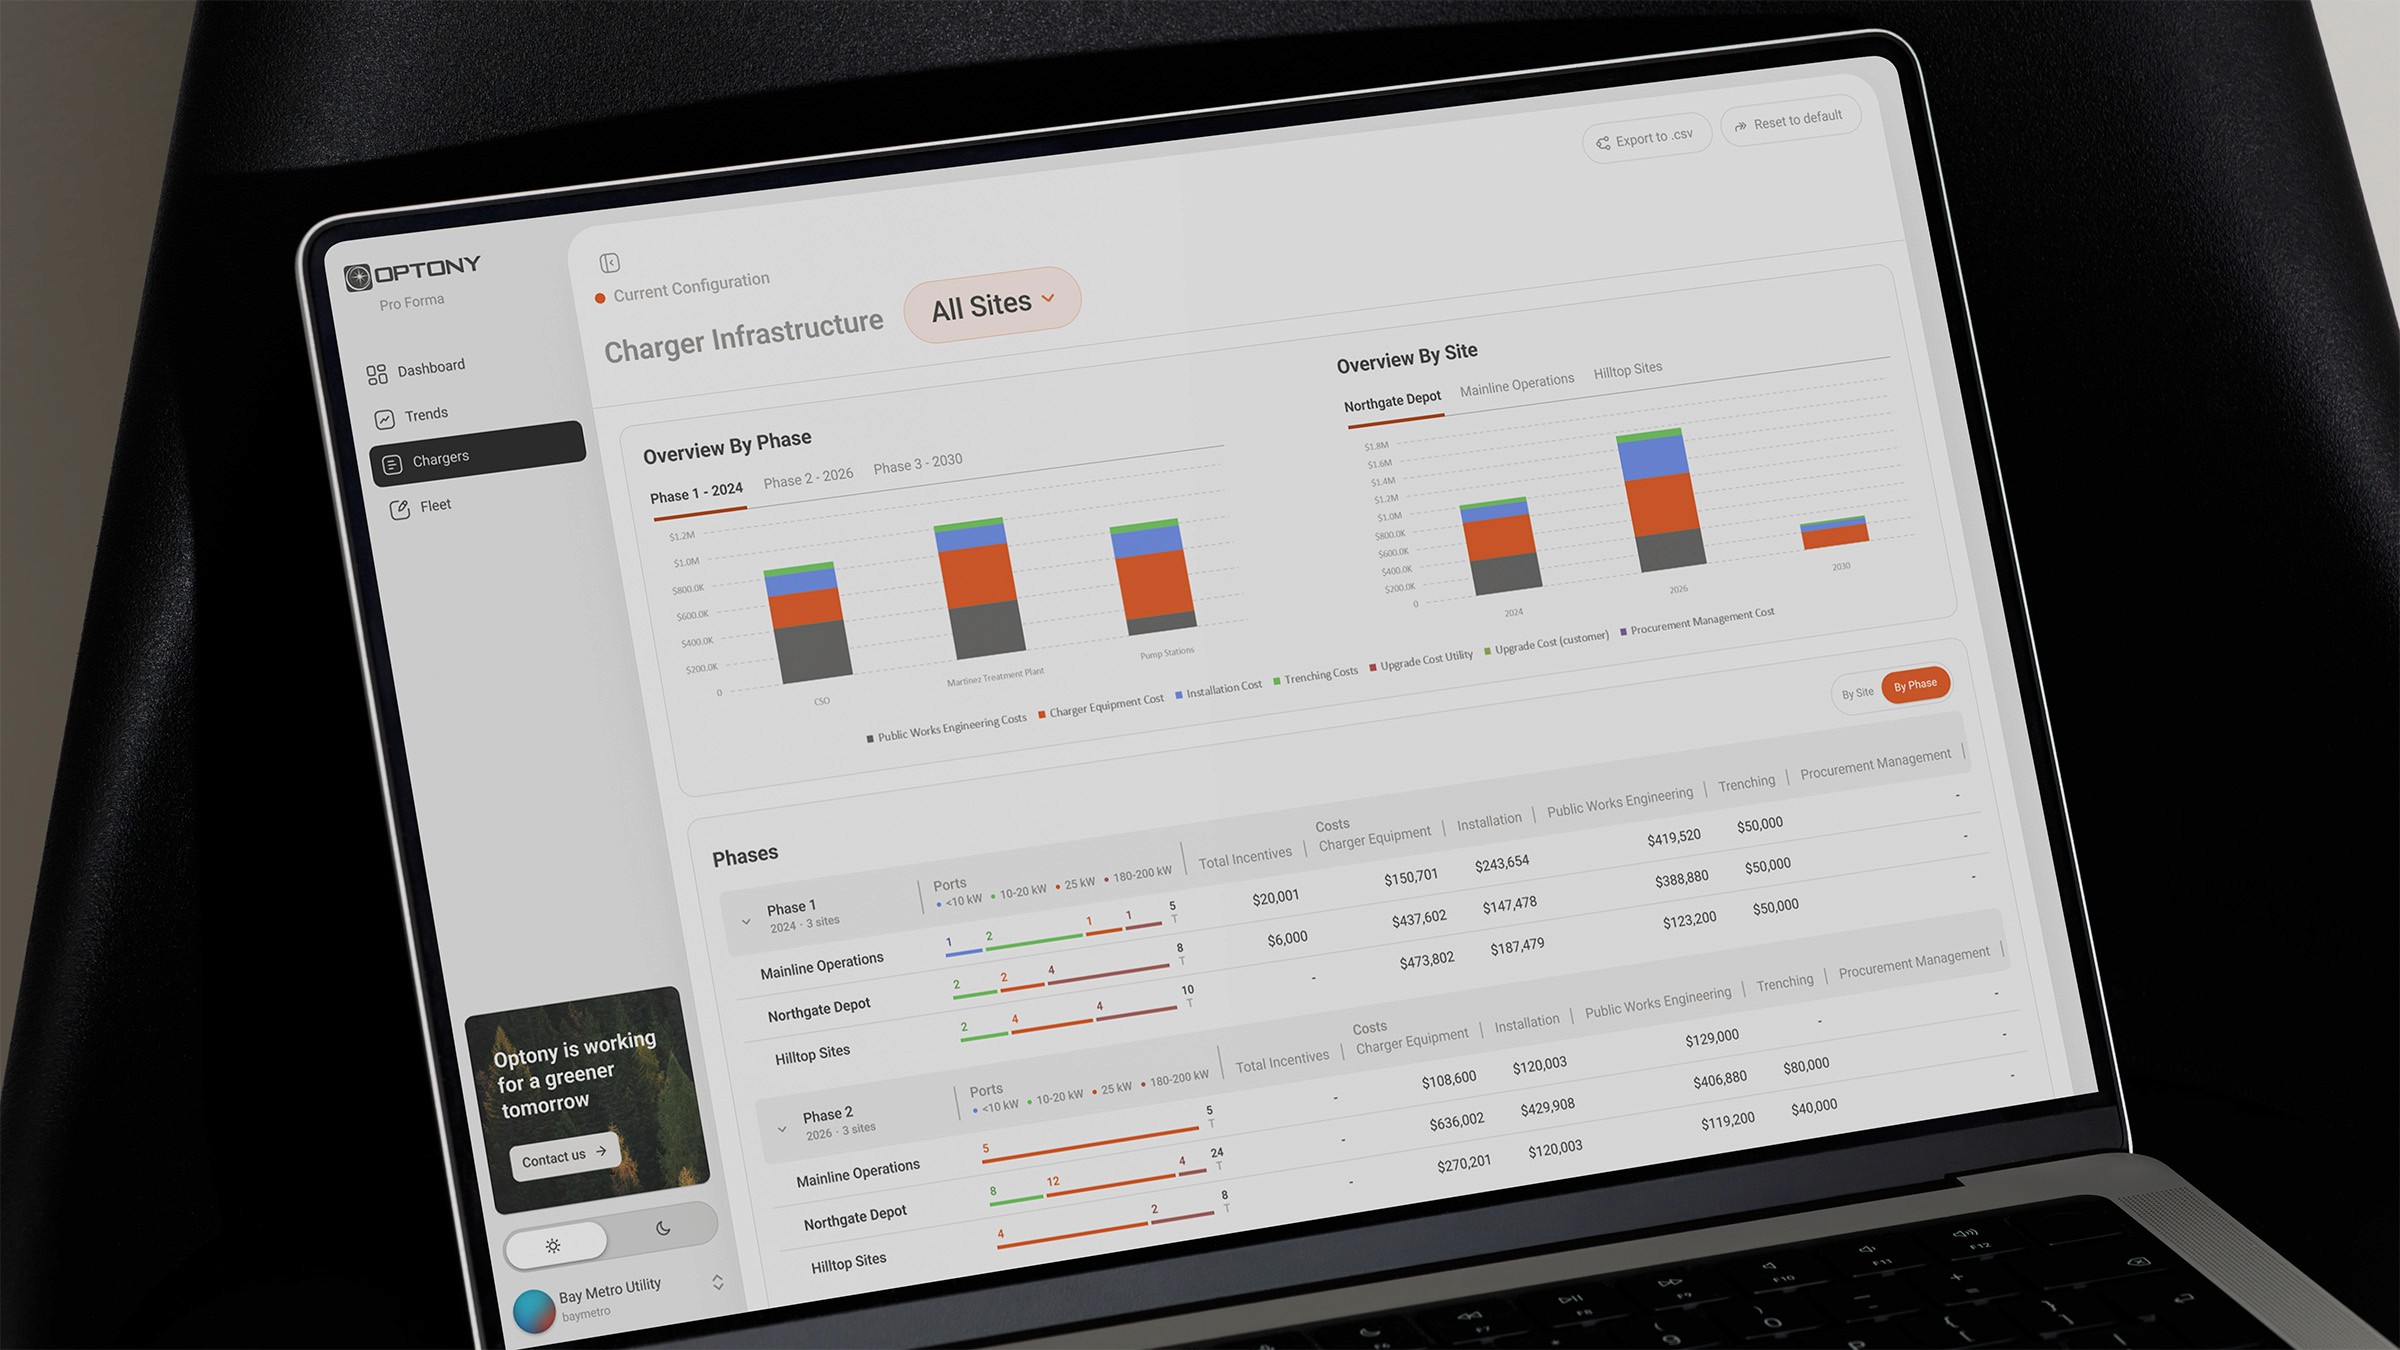
Transform heavy table data into digestible charts. Rather than forcing users to scan long tables for insights, every table had a summary chart above that provides clear, concise insights, and inline charts to compress unwieldy data.